
Obtaining the Data for KPI File
Weekly RRA File
Frequency: Updated Weekly by Monday 8am EST.
Send to:
|
Column/Metric |
|
|
Site |
Easton 2, Rialto 1, or Vancouver |
|
Week Beginning |
First day of the week (Sunday) |
|
Quality - Order Accuracy - Audits |
SISU - Total Orders Audited |
|
Quality - Order Accuracy -L1/2 Errors
Quality Control Questions |
SISU count of errors that are Level 1 or Level 2:
Be sure to be mindful of the timezone for SISU when working with other sites |
|
Quality - Order Accuracy - Target |
95.0% |
|
Quality - Fill Rate
N/A |
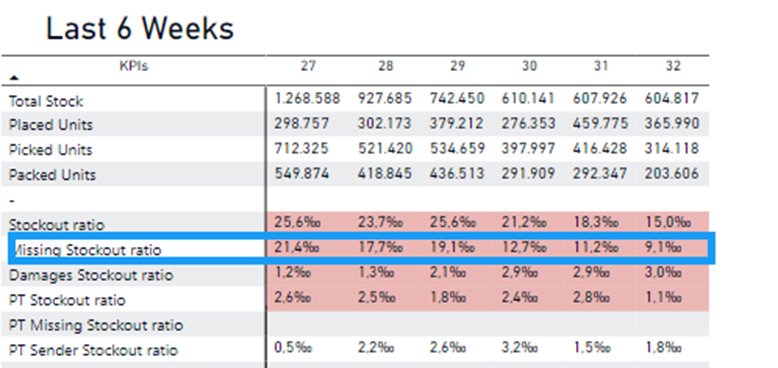
Zara Stockout PowerBI, https://app.powerbi.com/groups/me/reports/1485a6b1-4ec6-4422-a2e7-50df2b3b8ba3/ReportSection Missing Stockout ratio (converted to percent)
1 - (Missing Stockout ratio x 10) Be sure to be mindful of the timezone for SISU when working with other sites
|
|
Quality - Fill Rate – Target N/A |
99.8% |
|
Delivery - OB SLA – Orders |
Sum of Radial MSD Orders (from MSD Bridge Reports) |
|
Delivery - OB SLA - Misses |
Sum of True Delays (from MSD Bridge Reports) |
|
Delivery - OB SLA - Target |
99.9% |
|
Cost - UPH - Actual |
Current Week Facility UPH Select Previous week Put actual UPH from SIte |
|
Cost - UPH - Target |
Facility UPH for Month Prior Year + 10% (Simple source is YOY comparison PowerBI) Take previous year UPH (for same week) and add 10% |
No Comments